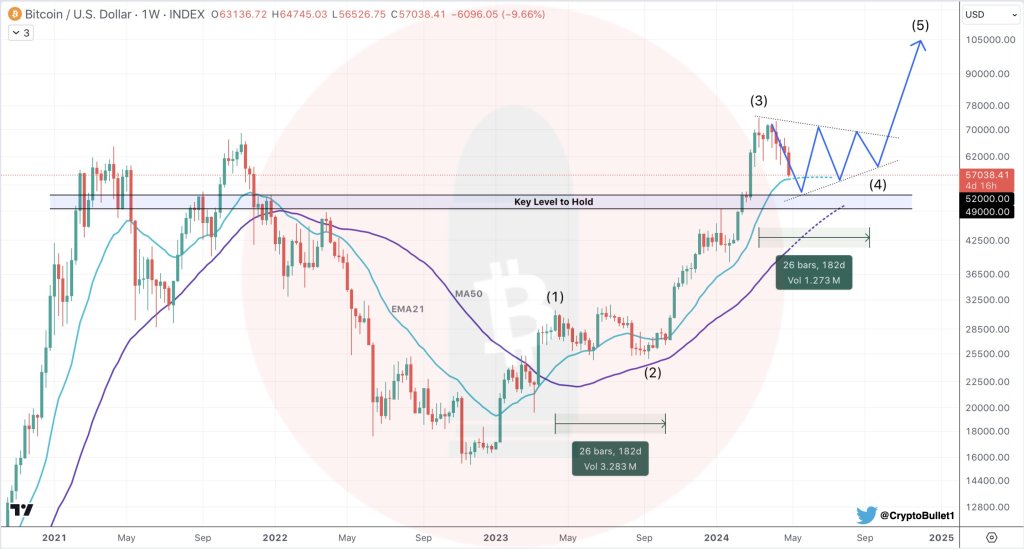
Despite Bitcoin’s 13% drop in the past week, which saw it break below the psychological $60,000 level and drop 20% from its all-time highs, one analyst on X remains resolute.
Drawing from the weekly chart, the trader maintains a bullish outlook, saying the coin will shake off weakness in the coming session. This aligns with bulls for the better part of Q4 2023 and Q1 2024.
Bitcoin Is Falling, Losses $60,000
Bitcoin is under intense liquidation pressure, struggling against the deluge of sellers. Earlier today, BTC broke below $60,000, melting below April 2024 lows.
This dump confirmed sellers of April 13, signaling a possible start of a bear formation that may see BTC lose ground, peeling back February and March 2024 gains.
Nonetheless, the analyst maintains that the uptrend will remain as long as Bitcoin stays above the $49,000 to $52,000 support zone, soaking up all selling pressure. This assessment, based on candlestick arrangement, can serve as a reassurance to BTC holders. The trader maintains that despite the sell-off, panic is unwarranted at this point.
Referring to the Elliott Wave Principle, a technical analysis indicator, the analyst points out that the coin is simply pausing. For those with a more aggressive trading strategy, the dip, ideally towards the above support zone, could present an opportunity to buy on dips in anticipation of Wave 5.

Currently, the analyst notes Bitcoin is in Wave 4, a stage that will take approximately the same time as Wave 2. Then, prices dumped after a brief rally, peaking in May 2023. However, prices rally in Wave 3, pushing prices below $30,000 to fresh all-time highs, peaking at $73,800.
The drop from all-time highs to spot rates, looking at the Elliot Wave Theory, could indicate that prices are in Wave 4 before the eventual leg up, ending at Wave 5.
Even so, when BTC will bottom up remains to be known. As things stand, the analyst said traders should watch two exponential moving averages (EMAs) of the 21 and 50 periods. A retest of these dynamic levels could offer support, preparing traders to buy on dips in anticipation of the final Wave 5.
However, the analyst didn’t lay out the next possible target even from the chart. Still, if Wave 3 is around the same length as Wave 5, Bitcoin has a strong chance to surpass $100,000 after the current volatile price action ends.
Feature image from DALLE, chart from TradingView
Disclaimer: The article is provided for educational purposes only. It does not represent the opinions of NewsBTC on whether to buy, sell or hold any investments and naturally investing carries risks. You are advised to conduct your own research before making any investment decisions. Use information provided on this website entirely at your own risk.


Comments (No)