
Fact Checker’s Full Profile
Author’s Full Profile

Will Bitcoin price hitting new ATH in December? What BTC USD charts and technical analysis tell us EOY for Bitcoin 2024?
Bitcoin ETFs have received inflows of hundreds of millions per day over the past week, and traders are now anticipating that December could mark the end of the year with another positive monthly close.
It is hard not to get excited when one sees such great news, though. Post-election, the Bitcoin ETFs’ assets under management (AUM) have increased by more than 120%—that is in just one month’s time.
U.S. 🇺🇸 Bitcoin ETF inflows by day 👇 in $ millions pic.twitter.com/GvCK6rbL7Z
— HODL15Capital 🇺🇸 (@HODL15Capital) December 13, 2024
But as the saying goes, technical Analysis is always our best friend when it comes to trading, rather than emotions. Emotions are a great indicator, though but lets check out the charts!
EXPLORE: 8 Coin That Could 100X
Deciphering The Mysteries Of Bitcoin Price – Technical Analysis When BTC Price Is Ranging
Having enjoyed good news about the orange coin phenomenon, let’s dive into the latest technical analysis of Bitcoin
![]() price.
price.
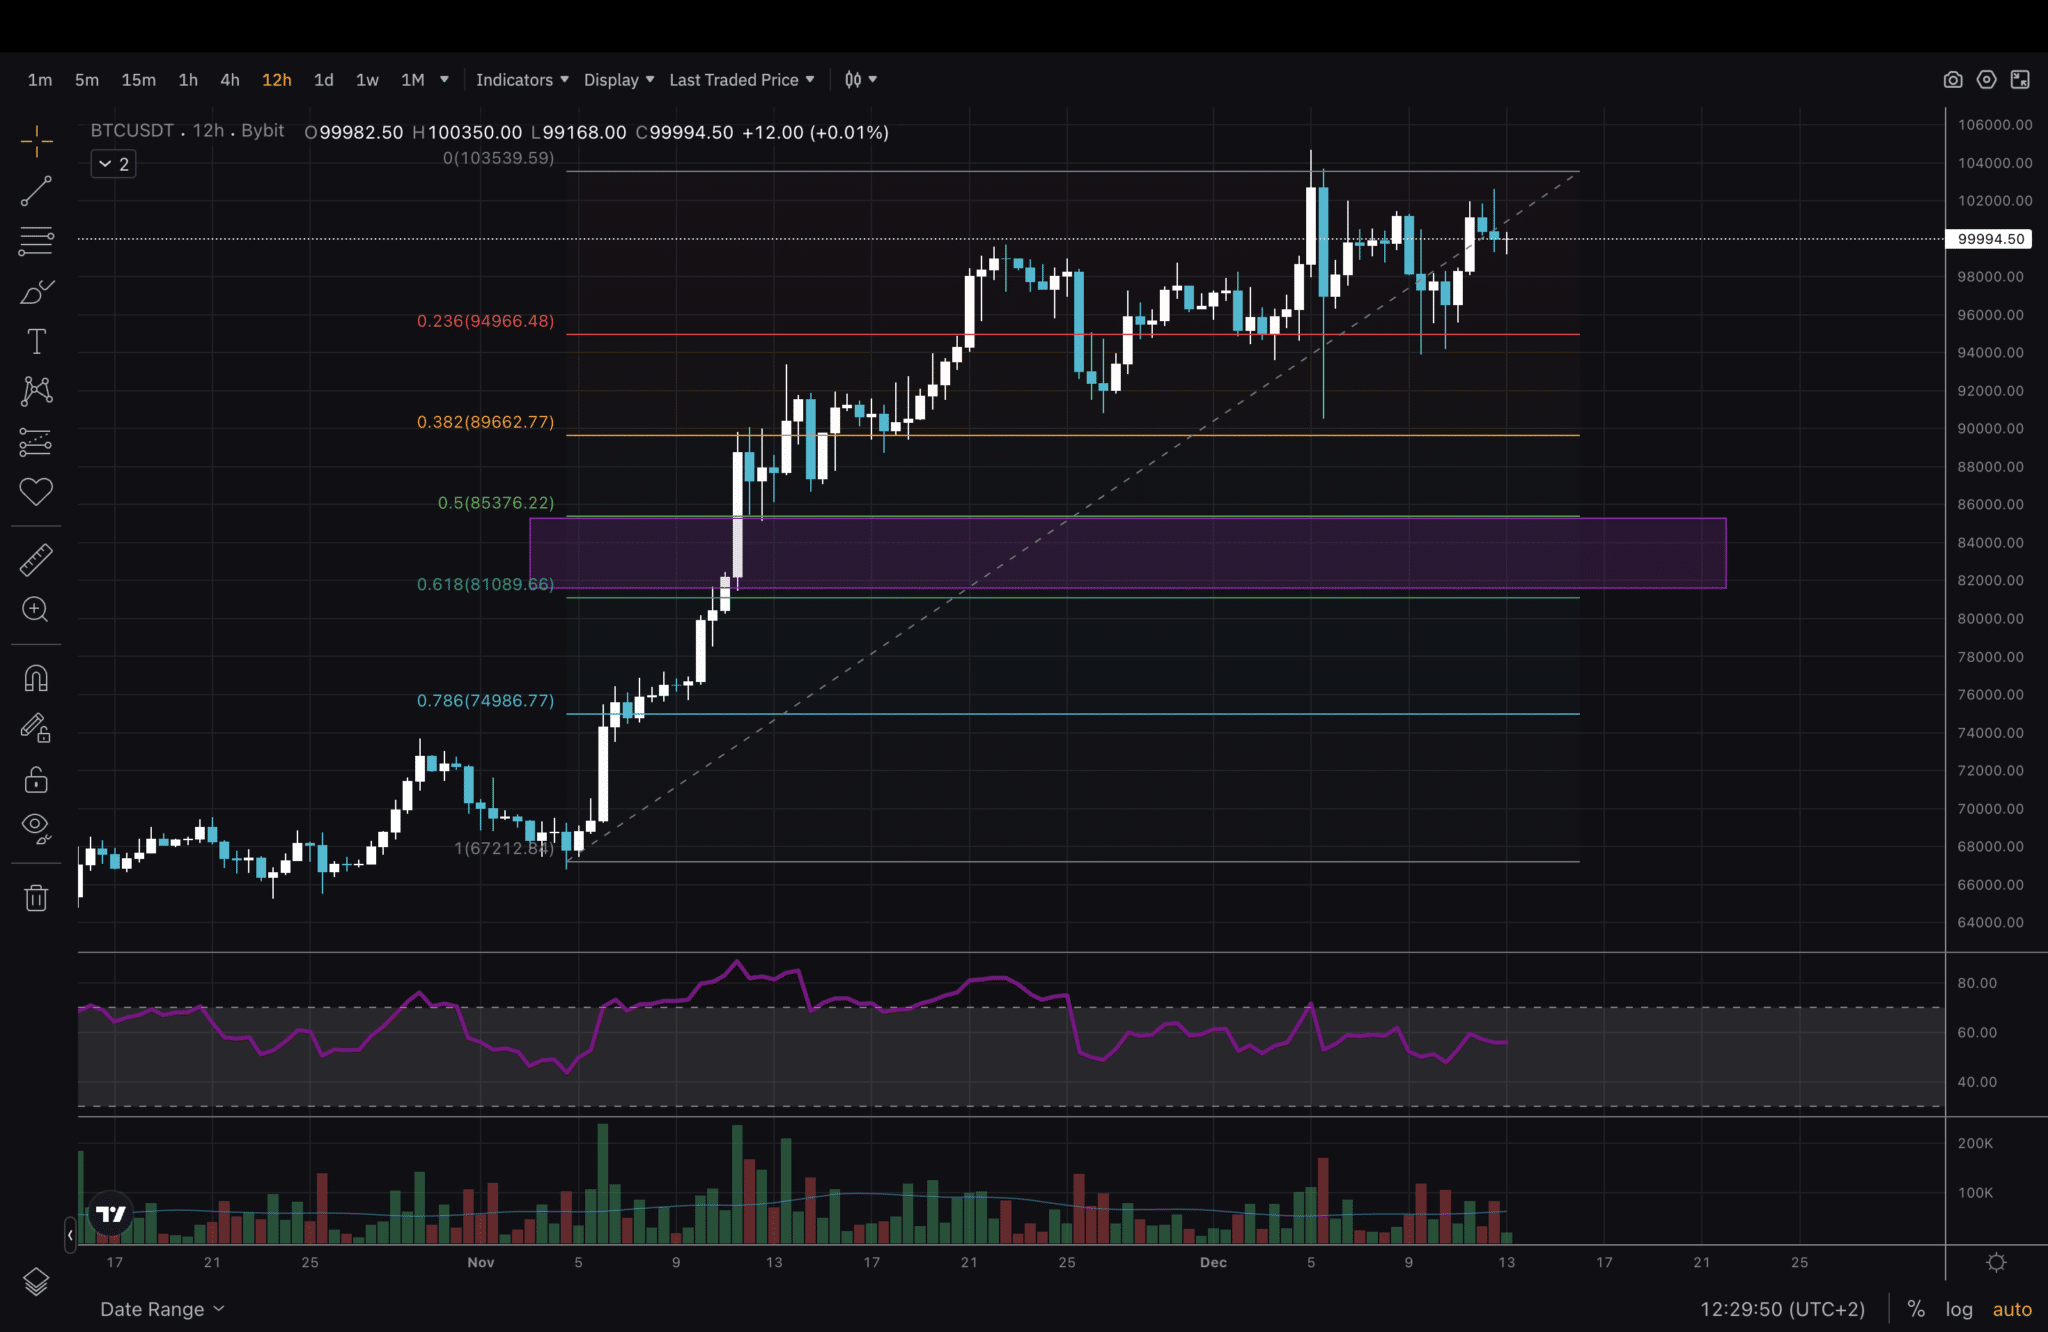
(BTC/USDT)
In my honest opinion, this is a difficult moment for a novice trader to decide whether to enter trades. I would rather wait to see how the price develops, and here is why.
The Bitcoin price chart above shows four big sell candles – a bearish engulfing pattern. Keep in mind this is a mid to high timeframe – 12H. There’s more weight to these candle closes than lower timeframes, such as 1H and 4H. We have also been rejecting the $100,000 level multiple times. Compared to my analysis last week, I have adjusted the Fib Retracement to the top, at almost $104,000. That is because we saw the price move above the first high multiple times and retested the 0.236 level.

(BTC/USDT)
Now, we have zoomed out and are looking at the 1D timeframe all the way to the beginning of 2024. Starting from the left, we see how the price gradually grew in an ascending channel in December 2023 and had a sell-off in January. From March to October, the Bitcoin price was in a descending channel and broke above a bit before the U.S. elections.
At the end of this year, we will see another ascending channel/wedge form. Sometimes, those are upward accumulations. Sometimes, they break below first, so I would be cautious. Either way, the uptrend is not broken until we have a daily close below $68,000.
The likelihood of this happening is rather low, considering all the ETF inflows that give long-term holders a good reason to keep holding. Even though we could see another pullback, Bitcoin remains bullish. Breaking above $104,000 should start the next leg higher.
EXPLORE: Best RWA Projects to Buy in 2024
Join The 99Bitcoins News Discord Here For The Latest Market Updates
Disclaimer: Crypto is a high-risk asset class. This article is provided for informational purposes and does not constitute investment advice. You could lose all of your capital.
99Bitcoins may receive advertising commissions for visits to a suggested operator through our affiliate links, at no added cost to you. All our recommendations follow a thorough review process.

We hate spam as much as you do. You can unsubscribe with one click.


Comments (No)